Video di città sommerse: ne abbiamo bisogno? — Flooded cities videos: do we need them?
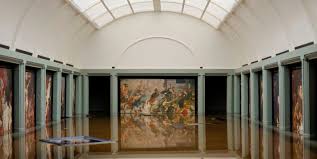
L’ultimo è stato proiettato all’Armory Show, una fiera d’arte contemporanea che si è appena conclusa (marzo 2020), a New York. È un video di Tezi Gabunia, un’artista georgiano, che fa vedere una sala del Louvre di Parigi che si riempie lentamente d’acqua fino a esserne quasi sommersa. L’acqua, segnale del cambiamento climatico, inascoltata, diventa tragedia e distruzione. Il cambiamento climatico non riguarda solo l’Antartide, i ghiacci che si sciolgono e i terreni riarsi nel sud del mondo. È qui e ora. La torre di Pisa, il Louvre a Parigi o Londra sommersi fanno crescere la nostra consapevolezza e mutano il nostro modo di fare architettura. Immagine in apertura e video dal sito www.ignant.com.
BREAKING NEWS: FLOODING OF THE LOUVRE Tezi Gabunia #ArmoryShow, TeziGabunia #tempodacqua #thetimeofwater
The last one has been shown in the contemporary art fair that has just ended (march 2020), at the Armory Show in New York. The video by Tezi Gabunia, a Georgian artist, shows a room in the Louvre in Paris that slowly fills with water until it is almost submerged. Water is a sentinel of climate change that, ignored, becomes tragedy and destruction. Climate change is not just about Antarctica, melting ice and parched land in the south of the world. It is here and now. The Tower of Pisa, Louvre in Paris or London city submerged increase our awareness and change the way we do architecture.
Global temperatures and sea levels are rising. Low-lying coastal cities are already experiencing devastating floods and working to come up with creative solutions to combat rising tides. Some cities are sinking due to increasing sea levels slowly encroaching on their coasts, while others are sinking because of excessive groundwater pumping that creates a change in pressure and volume that causes land to sink. Here are 11 sinking cities that are in danger of disappearing: Jakarta, Indonesia; Lagos, Nigeria; Houston, Texas, Dhaka, Bangladesh; Venice Italy, Virginia Beach, US; Bankok, Thailandia; New Orleans, US; Rotterdam, The Netherlands; Alwxandria, Egypt; Miami, US (for more information, click here)
.
Osservare l’acqua dallo spazio — Water Monitoring from Space
Si chiama WaMos Water Monitorin from Space e se ne occupa un’italiana, Elisa Fagiolini, che è CEO/CTO del progetto. In un’intervista concessa al centro di ricerca tedesco GFZ e ripresa da Perugia Today, Elisa ha spiegato che quando il ghiaccio sulla Groenlandia si scioglie, i ghiacciai perdono massa che scorre nel mare. Questo si può misurare dallo spazio, così come i serbatoi di acque sotterranee sotto la California sia quando stanno perdendo massa e anche quando il terreno è saturo d’acqua e quindi non può più assorbire la pioggia, aumentando il rischio di inondazioni. Con l’aiuto delle misurazioni dei campi gravitazionali, si possono prevedere sia la carenza d’acqua, sia le inondazioni.
WA.MO.S WATER MONITORING FROM SPACE Elisa Fagiolini #GZEHelmholtzCenterPotsdam #tempodacqua #thetimeofwater
It’s called Space’s WaMos Water Monitoring from Space. Elisa Fagiolini, who is CEO / CTO of the project, takes care of it. In an interview granted to the German research centre GFZ , also quoted in Perugia Today, Elisa explained when the ice on Greenland melts, the glaciers lose mass which flows in the sea. This can be measured from space. Another application is the measurement of groundwater reservoirs under California both when they are losing mass and when the ground is saturated with water and therefore can no longer absorb rain, increasing the risk of flooding. With the help of gravitational field measurements, both water shortages and floods can be predicted.
It’s used as measurements of gravity, i.e. gravimetry, to find out about the distribution of water on Earth. With the help of data from the satellite missions GRACE (2002 to 2017) and GRACE-Follow On (since mid-2018) we calculate maps of the Earth’s gravitational field every month. These maps not only depict continents and ocean basins with crusts of varying densities, but also the density and mass shifts in the Earth’s mantle as well as short-term changes in mass on and below the Earth’s surface.